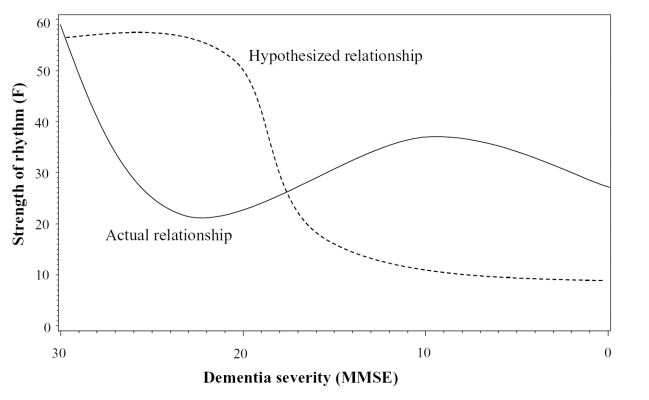
Figure 3.
Plot of the relationship between Mini-Mental State Examination (MMSE) score and the goodness-of-fit F-statistic. The dashed line indicates the hypothesized relationship, according to which rhythms would remain robust until the more severe stages of dementia. Once neuronal damage passes a critical threshold, there is a rapid decline in rhythmicity. In contrast, the solid line represents the actual relationship observed in those with less robust rhythms.

