Figure 4.

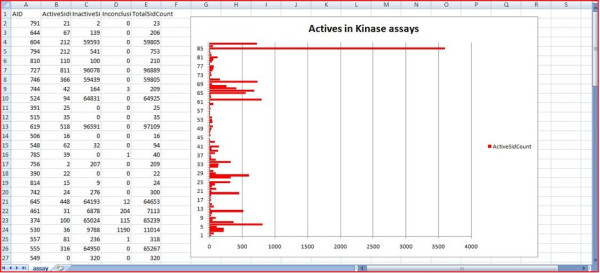
An analysis of kinase-related assays in Excel. Here a graph is used to compare the numbers of active compounds in each of the assays.

An analysis of kinase-related assays in Excel. Here a graph is used to compare the numbers of active compounds in each of the assays.