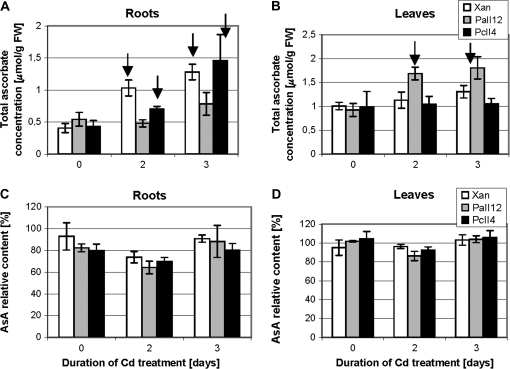
Fig. 12.
Total ascorbate concentration (A, B) and relative content of its reduced form AsA (C, D) in roots (A, C) and leaves (B, D) of 6-week-old tobacco plants: wild type var. Xanthi and transformed with AtPCS1 (lines PaII4 and PaII12) and CePCS (lines PcII3 and PcII4). Plants were grown under control conditions (–Cd) or exposed for 2 d and 3 d to 25 μM CdCl2. Values correspond to means ±SD (n=4). Significant differences between control (not exposed to cadmium) and Cd-treated plants of the same line are indicated with the arrow (P < 0.05).

