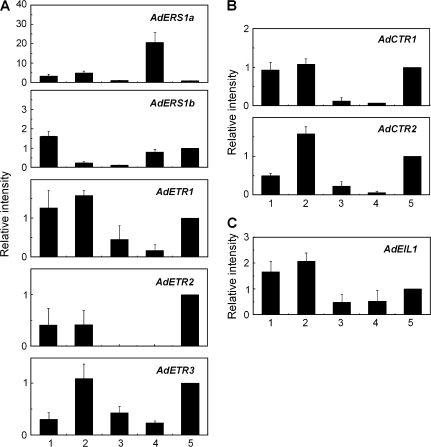
Fig. 2.
Expression of different components of the ethylene signalling pathway in various kiwifruit tissues: 1, root; 2, stem; 3, leaf; 4, petal; 5, fruitlet 1 month after anthesis (1 MAA). Real-time PCR was used to analyse AdETR (A), AdCTR (B), and AdEIL1 (C) expression patterns. Each column height indicates relative mRNA abundance, and 1 MAA (5) was set to 1. Error bars on each column indicate SEs from three replications.

