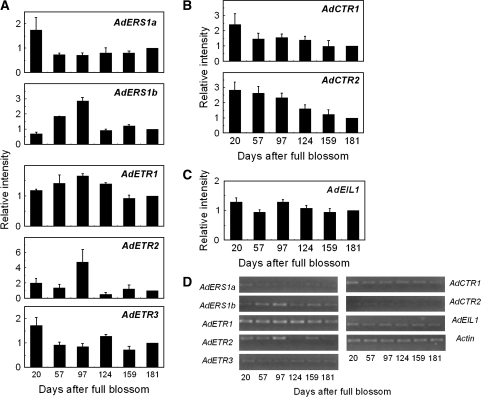
Fig. 3.
Expression of different components of the ethylene signalling pathway during kiwifruit development. Real-time PCR was used to analyse AdETR (A), AdCTR (B), and AdEIL1 (C) expression patterns. Each column height indicates relative mRNA abundance, and 181 DAFB was set to 1. Error bars on each column indicate SEs from three replications. (D) End-point PCR analysis of gene expression.

