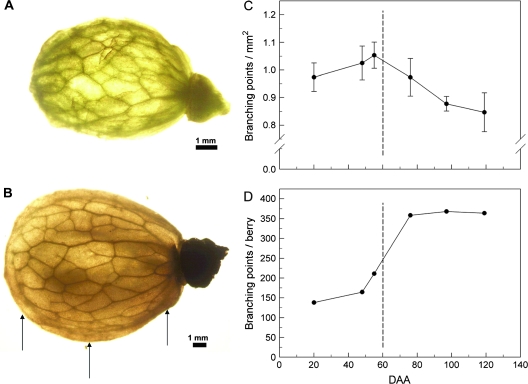
Fig. 3.
Backlit photograph revealing the peripheral vascular network in (A) pre- and (B) post-veraison peeled bisected berries. The number of branch points visible in a sample area of one-half of the peeled berry was used to calculate the number of branch points per unit area (C) and the number of branch points per berry (D). Arrows indicates the relative position of sections taken for the data of Fig 4. Data are means ±SD, n=10 berries.

