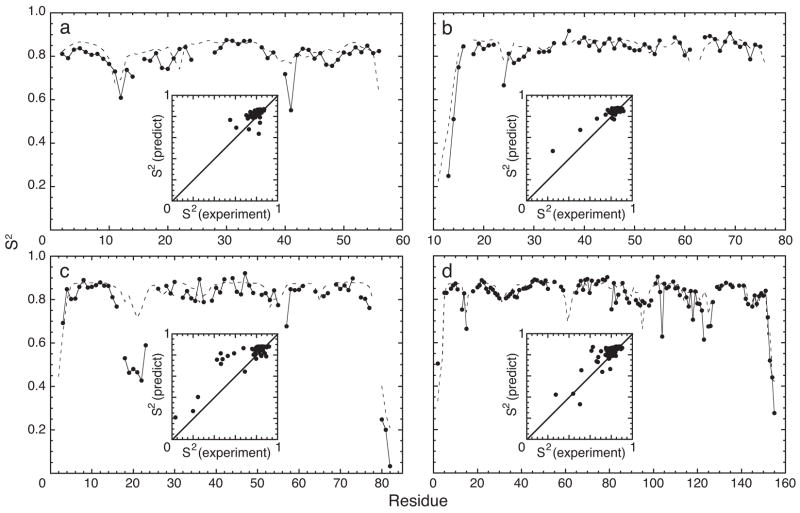
Fig. 4.
S2 for (a) GB3 (56 residues, 50 S2 values), (b) HP67 (67 residues, 54 S2 values), (c) fren ACP (83 residues, 64 S2 values) and (d) RNase H (155 residues, 120 S2 values). (—) Experimental measurements and (- - -) neural network predictions are plotted as a function of residue number. Insets: Predictions are plotted versus experimental values; the x- and y-coordinates ranges from 0 to 1. Predicted values were calculated using structural coordinates from PDB files (a) 1IGD, (b) 1QQV, (c) 1OR5, and (d) 2RN2.

