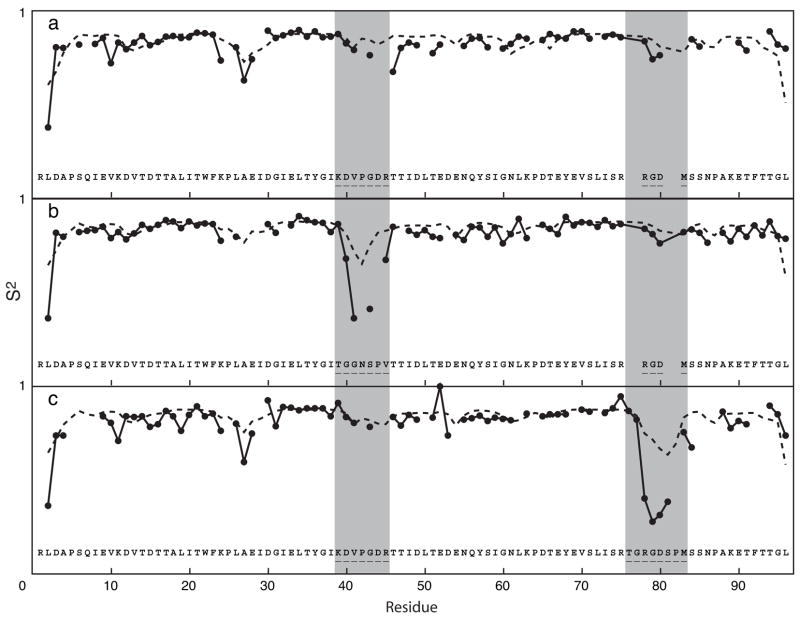
Fig. 6.
S2 of tnfn3 domain (a) and its mutants (b, c); (—) experimental measurements; (- - -) neural network predictions. The y-coordinate of each section ranges from 0 to 1. Residue numbering is based on the longest construct, the RGD loop swap variant. The location of the CC′ and RGD loops is highlighted in gray. The mutations introduced are shown for each variant protein. Structures of the tnfn3 domains used for predictions are described elsewhere [41]. The correlation coefficients between experimental and predicted S2 values are (a) 0.512, (b) 0.635, and (c) 0.759.

