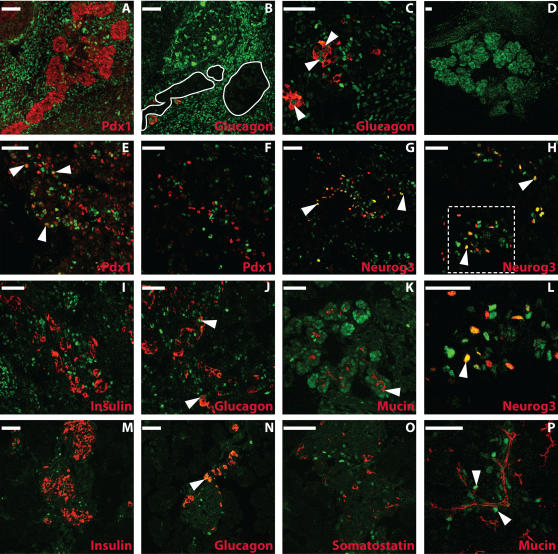
Figure 2. GFP expression in the mouse pancreas of math6 +/EGFP-Cre mice.
Staining for GFP (Math6) in green is shown alone (D) or with Pdx-1(red; A,E,F), Neurog3 (red; G,H,L), glucagon (red; B,C,J,N), insulin (red; I,M), somatostatin (red; O) and mucin (red; K,P) at E12.5 (A–C), E14.5 (D) E15.5(E–L) and E 17.5(M–P). In B, pancreatic epithelium (absent of GFP staining) is outlined in white. Note that the epithelium coincides with the Pdx-1 expression domain as shown in panel A. In C, J and N, arrowheads indicate examples of cells coexpressing Math6 and glucagon. In E, arrowheads indicate cells coexpressing Math6 and Pdx-1. In G,H and L (H-Inset), arrowheads indicate cells coexpressing Math6 and Neurog3. In K and P, arrowheads indicate an example of cells coexpressing Math6 and mucin. Red and green channels are shown separately (scale bars = 50 µm).

