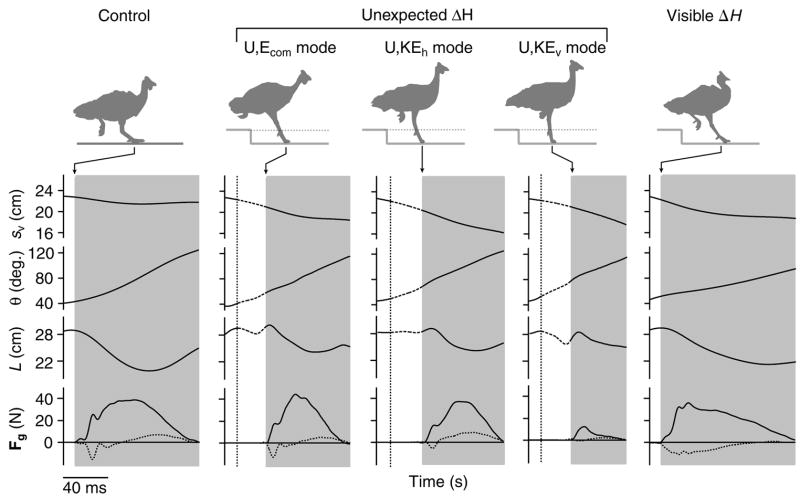
Fig. 3.
COM height (sv), limb angle relative to horizontal (θ), limb length as the distance between hip and toe (L) and vertical (fv, solid line) and horizontal (fh, dotted line) components of ground reaction forces during the C, U and V treatments. The three U trials show typical examples corresponding to the three distinct COM energy response patterns (Daley et al., 2006). Silhouettes illustrate limb posture at the point of ground contact. Dotted line indicates the time of tissue paper contact, and the grey bars indicate duration of ground contact (tc). Ground reaction forces and COM position data were reported previously (Daley et al., 2006) and are shown here for reference. In the present paper we relate the limb loading and energy patterns to joint mechanics during the step following the perturbation.

