
Fig. 10.
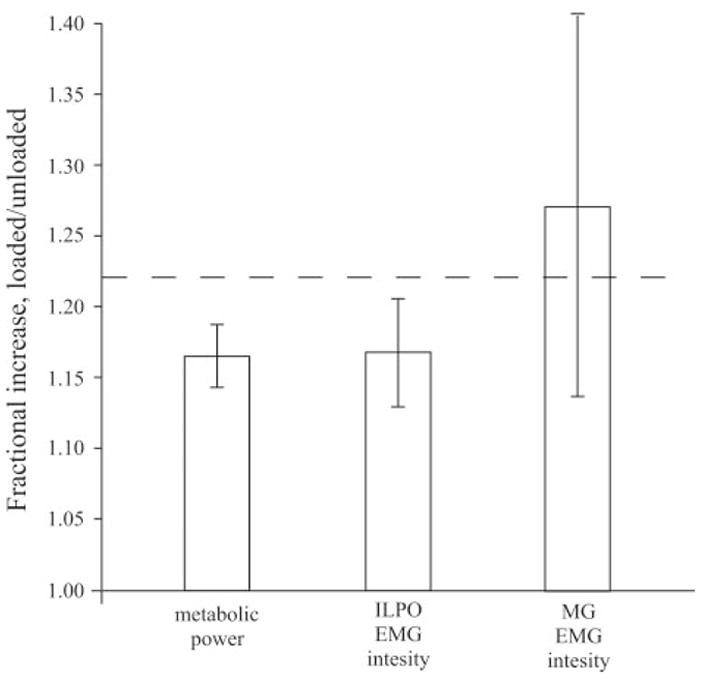
Fractional increases in metabolic power and EMG intensity in both muscles averaged across 0.5, 1.0, and 1.5 m/s were not significantly different. Dashed line represents the fractional increase in mass due to load (1.22). EMG intensity for 3.0 m/s was not included because oxygen consumption data were not available at this speed.