
Fig. 5.
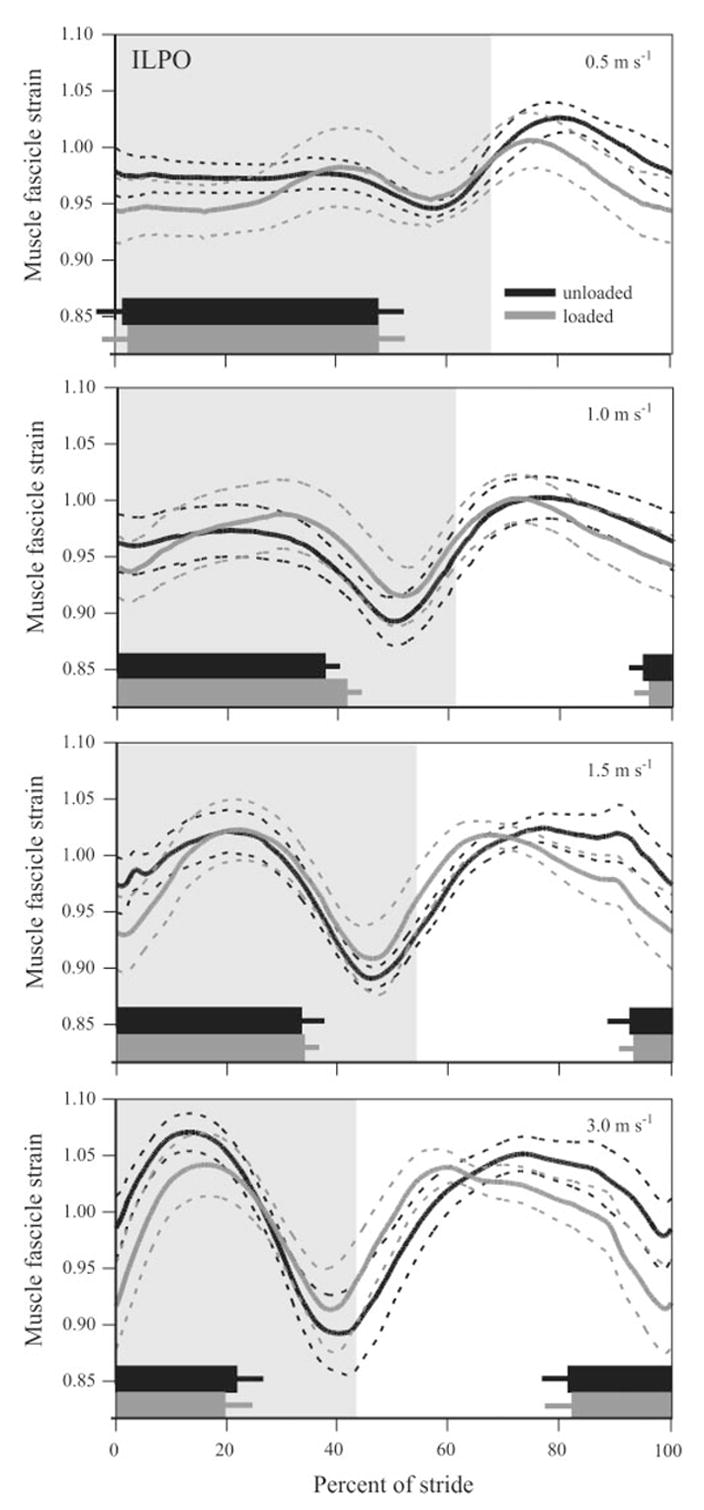
Mean in vivo muscle fascicle strain patterns recorded from the ILPO across all animals (n = 4) plotted vs. percent of stride for all speed and load conditions. Relative timing of EMG onset and duration during unloaded (black) and loaded (gray) conditions are shown as thick bars at each speed. The ILPO is active before foot down with EMG onset occurring during the swing phase, except at 0.5 m/s, in which the error bars extend beyond the y-axis. Shaded areas indicate stance phase. Dashed lines and error bars represent ±1 SE. Note: thickness of the EMG bars does not indicate relative intensity.