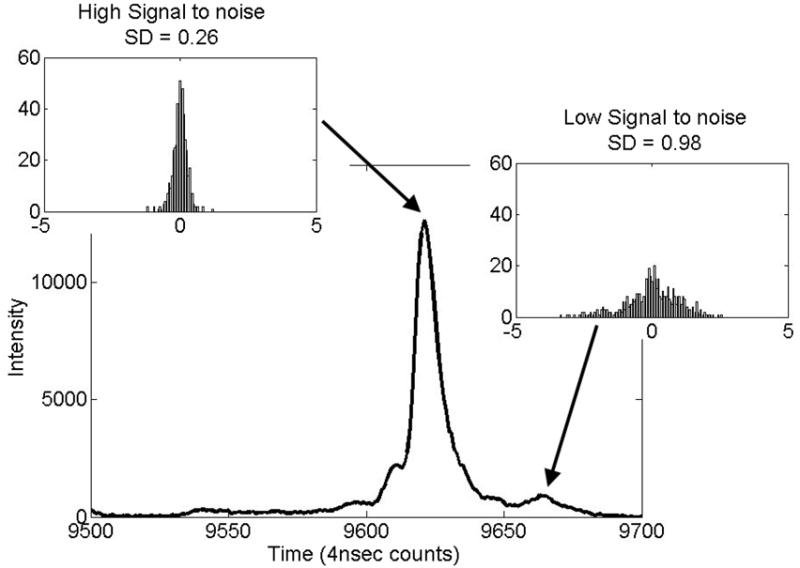
Figure 5.

Histograms illustrating successful alignment of two peaks with different S/Ns. The peak at t = 9621 was used for alignment in reference [25] and in this study. The peak at t = 9663 has a significantly lower S/N and associated higher location uncertainty.
