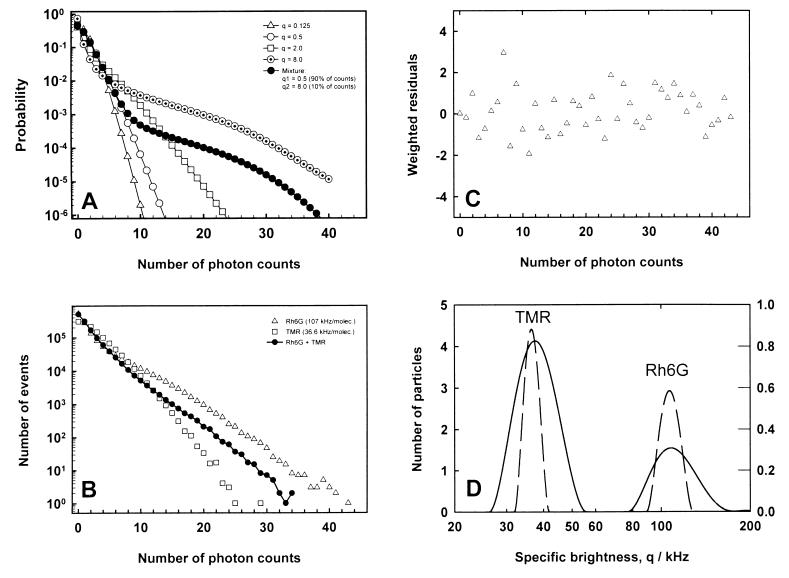
Figure 1.
Theoretical and experimental distributions of the number of photon counts. (A) Expected probability distributions P(n) for five cases of equal mean count rate, n̄ = 1.0. The open symbols correspond to solutions of single species but with different values of the mean count number per particle qT. The solid line is calculated for a mixture of two species, one with qT = 0.5 and the other with qT = 8.0. (B) Measured distributions of the number of photon counts. The data for three samples are presented: the solutions of 0.5 nM Rh6G, 1.5 nM tetramethylrhodamine (TMR), and a mixture of them (0.8 nM TMR, 0.1 nM Rh6G). The time window of 40 μs was used, and the number of photon counts was determined 1,250,000 times in each of the 50s experiments. (C) Weighted residuals from multicomponent fit analysis of the count number distribution measured for Rh6G. (D) Results of ITR analysis applied to the curves shown in Fig. 1B. The dashed lines correspond to the solutions of single dyes (Rh6G and TMR), and the solid line corresponds to their mixture. The ordinates give the mean number of particles within the confocal volume element (left, single dyes; right, mixture).

