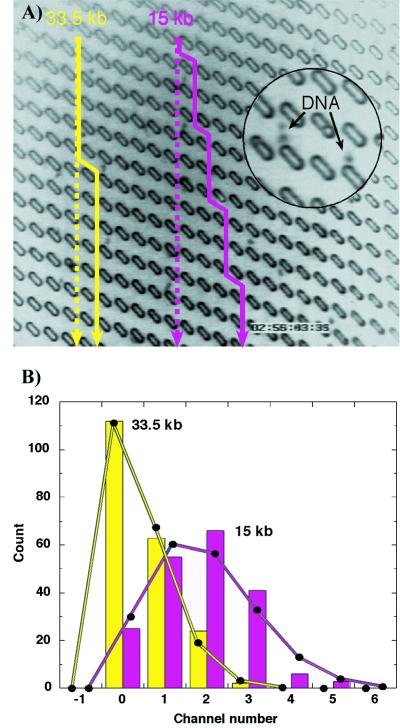
Figure 3.
(A) The trajectories of XhoI-digested bacteriophage λ DNA fragments. The straight lines show the average electric field direction. The solid yellow line traces the path of a 33.5-kbp fragment; the purple line traces a 15-kbp fragment. The frame size is 130 × 114 μm2. Total dimension of the separation device is 3 × 4 cm, and electric field strength is 1.4 V/cm. (A video clip illustrating the process is available at http://suiling.princeton.edu.) (B) Histogram of the deflection of approximately 200 DNA fragments of each size after they have passed through 14 gates (the vertical distance in A). Scale at bottom indicates the total number of channels that the molecule has shifted to the right. The solid lines are binomial distributions with the same mean and area as the experimental data.

