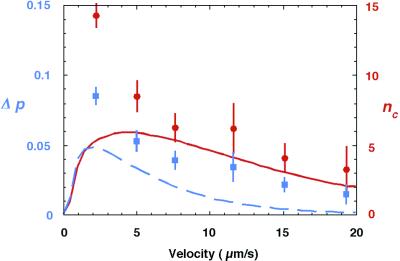
Figure 4.
Difference Δp in the probability per gate that 15-kbp and 33.5-kbp molecules skip to the right (blue). Extrapolated number of bands nC that could be detected between 15 kbp and 33.5 kbp in a 10-cm sieve (red). Lines are theoretical predictions for Δp (blue) and nC (red). The theoretical curve of Δp is taken from Eq. 1 of ref. 6, substituting in the two values of D/va, and calculating pR and pL for both fragments: Δp = [pR(15 kbp) − pL(15 kbp)] − [pR(33.5 kbp) − pL(33.5 kbp)]. Theoretical curve for band capacity nC uses variance σ2 = N [pR(1 − pR) + pL(1 − pL) + pRpL)], given in ref. 6, where N = 12,500 gates.

