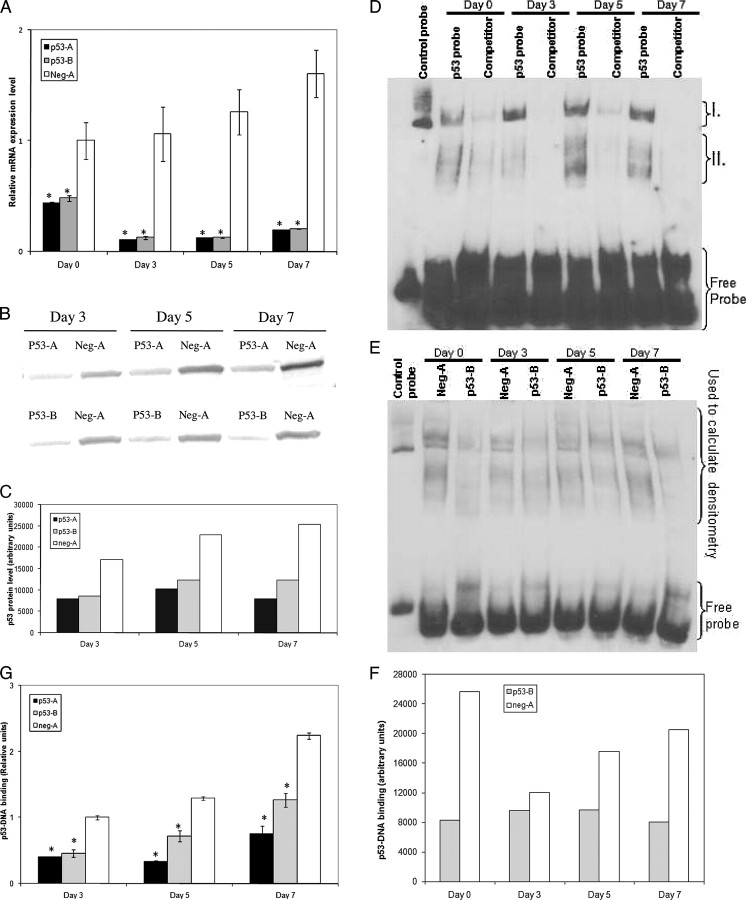
FIGURE 1.
Expression of p53-A and p53-B shRNA-mir effectively decreases p53 expression and activity. A, CHRF cells stably expressing p53-A (black), p53-B (gray), or neg-A (white) shRNA-mir were analyzed by Q-RT-PCR for p53 mRNA abundance. The p53 mRNA expression data were normalized to those of the CHRF-neg-A unstimulated controls. Error bars, S.E. (n = 3–6). B, Western blot analysis of p53 in whole cell lysates from CHRF cells stably expressing the given shRNA-mir at the designated time points after PMA stimulation. C, densitometry of the Western blot in B shown with arbitrary units. D, EMSA of nuclear extracts from CHRF-neg-A cells using biotinylated p53 consensus binding sequence oligonucleotides. Regions I and II (discussed under “Results”) represent low and high mobility p53-DNA complexes, respectively. Competitor lanes were preincubated with unlabeled p53 consensus binding sequence oligonucleotides to verify band specificity. E, EMSA of differentiating CHRF-neg-A and CHRF-p53-B nuclear extracts incubated with biotinylated p53 consensus binding sequence oligonucleotides. F, densitometry of the indicated region from EMSA in E, shown with arbitrary units. G, the binding of p53 protein from nuclear lysates to p53 consensus-binding sequence DNA oligonucleotides was measured by ELISA as described under “Experimental Procedures.” Binding level is shown in arbitrary units normalized to CHRF-neg-A cells from day 3. Error bars, S.E. (n = 2–4). A and G, an asterisk denotes statistically significant difference versus corresponding neg-A-expressing CHRF cell sample from the same time point. A, p < 0.01; G, p < 0.05.

