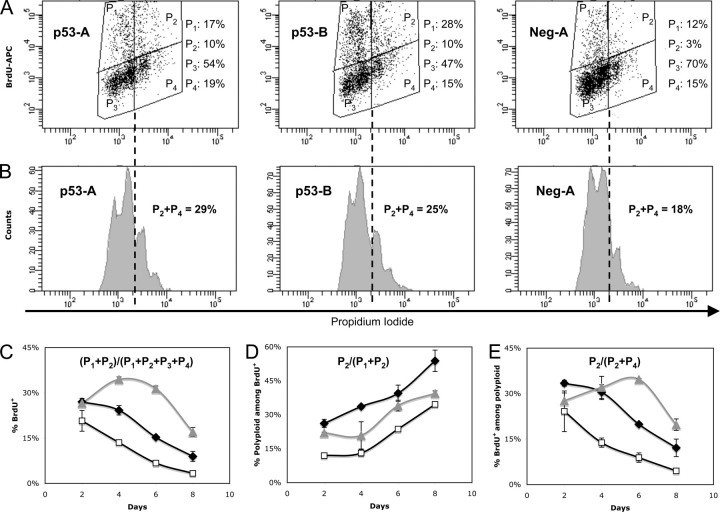
FIGURE 3.
Knockdown of p53 expression increases DNA synthesis in CHRF cells undergoing terminal Mk differentiation. CHRF-p53-A (black diamonds), CHRF-p53-B (gray triangles), and CHRF-neg-A (open squares) cells were stimulated with PMA, and DNA synthesis was assessed by flow cytometry after a 12-h incubation with 10 μm BrdUrd followed by intracellular staining of the cells with an APC-conjugated anti-BrdUrd antibody, RNase treatment and counterstaining with propidium iodide to evaluate DNA content. Representative cell cycle/DNA synthesis (A) and ploidy among total cells (B) data from day 4 after PMA stimulation are shown for CHRF-p53-A, CHRF-p53-B, and CHRF-Neg-A cells. The sum of 2 n/4 n cells gated by P1 and 8 n/higher cells gated by P2 represents the total number of cells undergoing DNA synthesis (BrdUrd+). Gates P3 and P4 represent the noncycling 2 n/4 n and 8 n or higher cells, respectively, and constitute the BrdUrd– cells. DNA synthesis was assayed on days 2, 4, 6, and 8 after PMA treatment. DNA synthesis assessed among total cells (C). Polyploidy assessed among cells undergoing DNA synthesis (D). DNA synthesis measured among polyploid cells (E). Error bars, S.E. (n = 2). All data presented in this figure were acquired using protocol 2 for analysis of DNA synthesis as described under “Experimental Procedures.“

