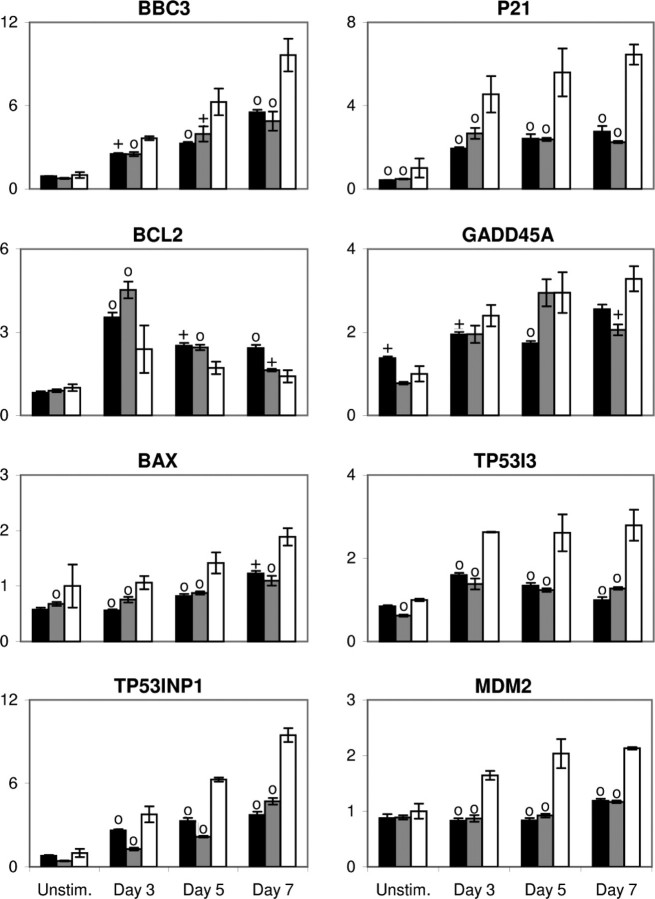
FIGURE 7.
Modulation of p53 expression alters gene expression in differentiating CHRF cells. Q-RT-PCR analysis of mRNA abundance in PMA-induced cultures of CHRF cells expressing the p53-A (black), p53-B (gray), or neg-A control (white) shRNA-mir are shown for the designated genes. Data were normalized across samples using the average of two housekeeping genes (GUSB and RPLP0). For each gene, data were standardized to the expression in unstimulated CHRF-neg-A cells. Error bars, S.E. (n = 3–6). Crosses and circles denote statistically significant differences (p < 0.05 and p < 0.01, respectively) versus the corresponding neg-A-expressing CHRF cell sample from the same time point.

