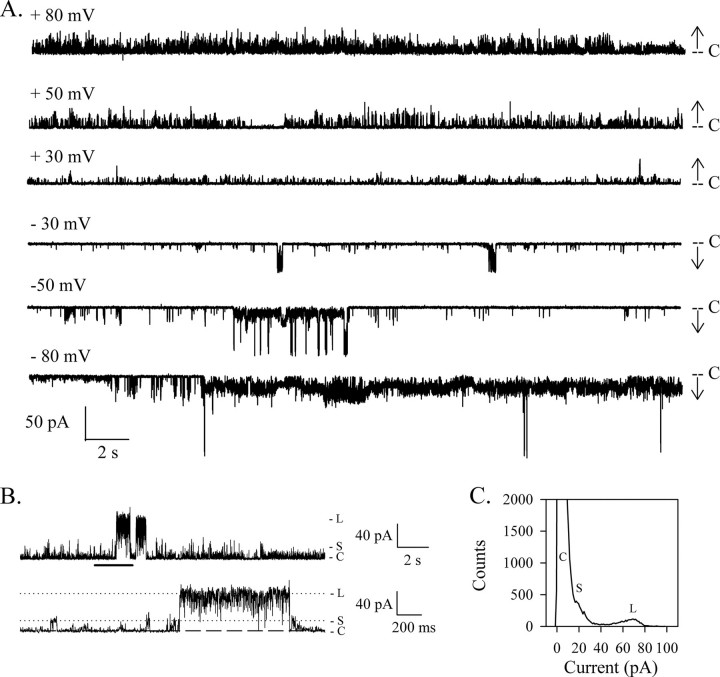
FIGURE 1.
HMW1B forms ion-conductive pores. A, representative current traces of HMW1B obtained from the same single inserted protein at the indicated voltages. The current level corresponding to the closed channel is marked by C. The arrows show the direction of openings (upward and downward deflections at positive and negative voltages, respectively). B, HMW1B displays two main levels of conductance, labeled S and L and indicated by the tick marks. The bottom trace shows 2 s of the upper trace (marked by the thick horizontal bar) on an expanded time scale to highlight the details of the two types of openings. The voltage was +50 mV. C, amplitude histogram from the whole trace showed in B. C, closed; S, small conductance state; L, large conductance state.

