FIGURE 2.

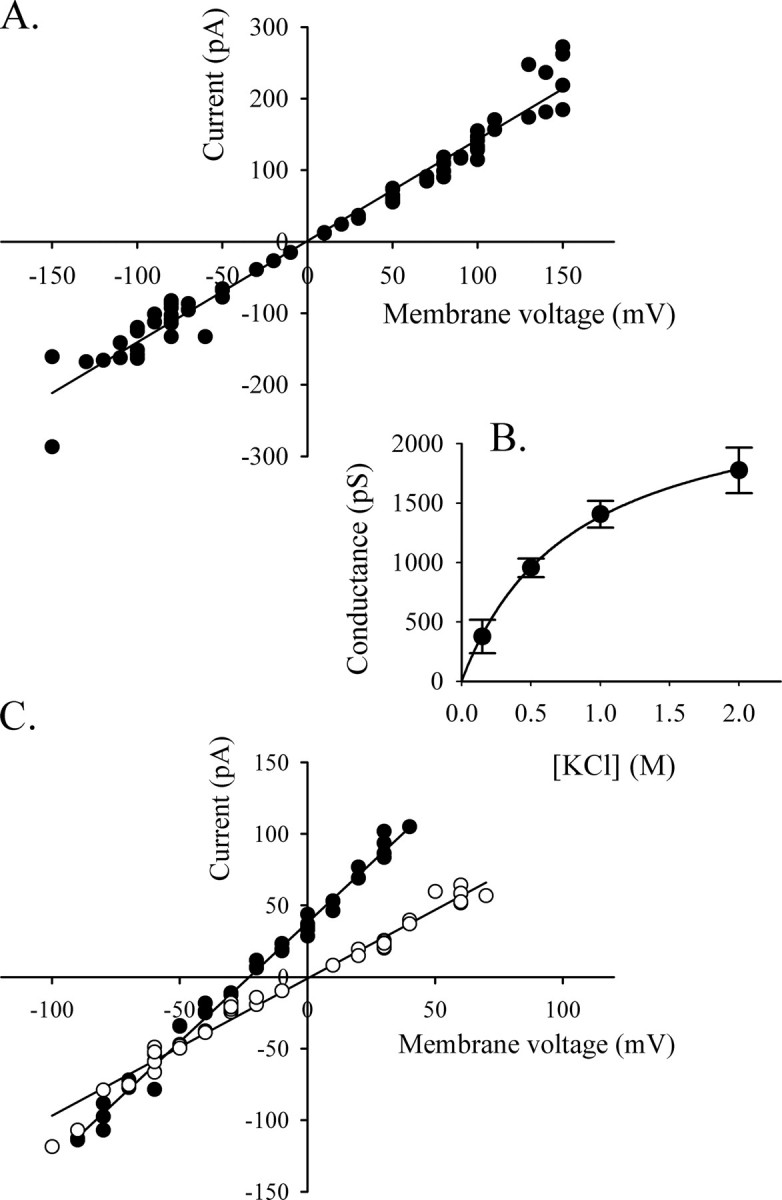
Conductance and selectivity of HMW1B. A, current-voltage (I/V) curve of the L conductance in 1 m KCl (pH 7.2). The current was measured from nine independent experiments at different voltages and plotted on the ordinate. The best fitted line was calculated with Sigmaplot, and the slope gives a conductance of 1417 pS. B, the current of the L conductance saturates with increasing salt concentration. The conductance was calculated from the I/V curves from at least three independent inserted proteins in each condition. The data represent the average conductance ± S.E. of the L openings. The fit to the Michaelis-Menten equation gave the following parameters: Gmax = 2505 pS, and Km = 808 mm. C, the reversal potential of HMW1B was measured from the L openings in the presence of a salt gradient of 1500/500 mm KCl (cis/trans)(closed circles, n = 3). The observed Erev of –22 mV in these conditions corresponds to a PK/PCl of 11.3. The open circles show the I/V relationship in symmetrical conditions of 500/500 mm KCl (n = 4).
