
FIGURE 2.
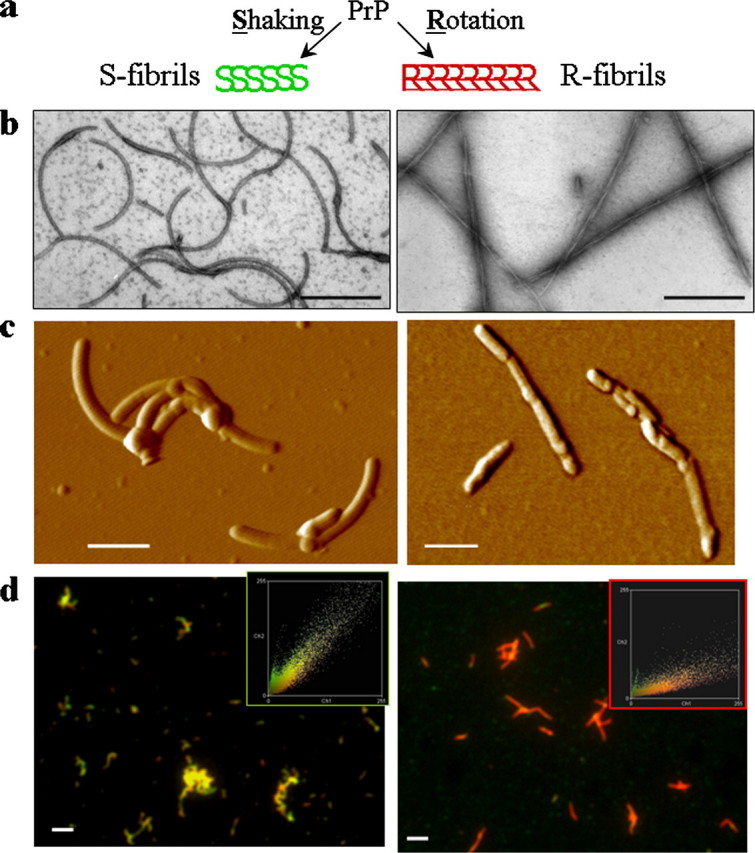
a, S- and R-fibrils were produced from the same stock of PrP under identical solvent conditions but different agitation modes (as described under “Experimental Procedures”). Negative staining EM images (b), AFM images (c), and double staining immunofluorescence microscopy images (d) of S-fibrils (left panels) and R-fibrils (right panels) are shown. The microscopy images were transformed into two-dimensional fluorescence intensity scattering plots (insets) as previously described (12). Red fluorescence intensities are plotted on the horizontal axis, and the green intensities are plotted on the vertical axis. Scale bars, 0.2 μmin b and c and 2 μm in d. The apparent discrepancy in thickness of fibrils in AFM versus EM images is due to the fact that the negative staining EM imaging reports the pattern of positive charges on the fibrillar surface and underestimates the real thickness, whereas the AFM imaging overestimates the thickness due to the convolution effect.