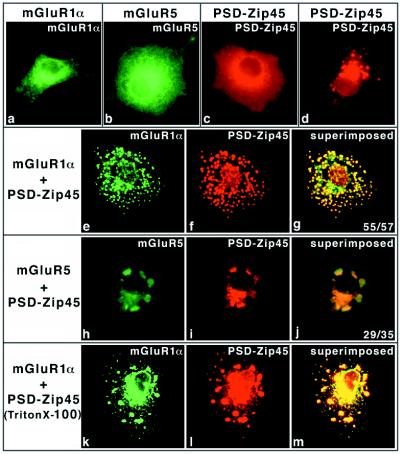
Figure 3.
Group 1 mGluR clustering induced by PSD-Zip45. COS-7 cells were microinjected with plasmid DNAs listed at the top or left of each column. After microinjection (3 hr), the cells were fixed and double labeled with mAb 126H and/or anti-mGluR1α or anti-mGluR5 polyclonal antibodies. In the case of d, the cells were stained with mAb 126H at 9 hr after microinjection. The stained proteins are indicated (Top). In some experiments (k–m), the cells were permeabilized with 0.1% TritonX-100 before fixation. (g and j, Inset) Clustering scores (cell number showing clusters/examined cells). Final concentrations of plasmid DNAs are as follows; mGluR1α (0.1 mg/ml), mGluR5 (0.2 mg/ml), and PSD-Zip45 (0.2 mg/ml).

