Figure 2.
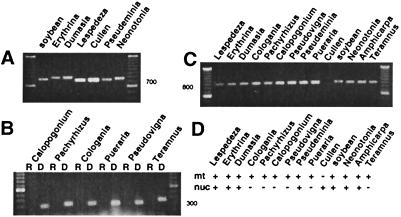
Detection of mt and nuclear cox2 transcripts by RT-PCR. (A) Agarose gel showing RT-PCR products generated by using primers that amplify almost all of the nuclear cox2 targeting sequence plus about half of the mature coding region (700–790 bp). Sizing marker is a 100-bp ladder. (B) RT-PCR and PCR products obtained by using primers that amplify the nuclear cox2 targeting sequence. RT-PCR reactions are indicated by “R” whereas control PCRs using genomic DNA as template are indicated by “D.” (C) RT-PCR products generated by using primers that amplify the entire mt cox2 coding sequence (≈885 bp). (D) Summary of RT-PCR data, indicating the presence (+) or absence (−) of detectable transcripts in the mitochondrion (mt) or nucleus (nuc) of the indicated species.

