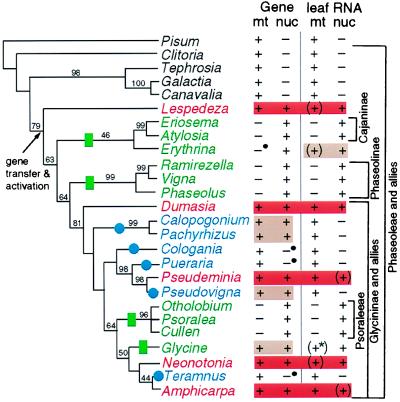
Figure 5.
Summary of cox2 gene distribution and transcript data in a phylogenetic context. The left two columns indicate the presence (+) or absence (−) of an intact cox2 gene in the mitochondrion (mt) or nucleus (nuc) of the indicated species. Bullets indicate genes containing small insertions or deletions that disrupt the reading frame or intron splicing. The right two columns indicate the presence (+) or absence (−) of detectable mt and nuclear cox2 transcripts in young leaves. Parentheses indicate transcripts present at low levels; the asterisk indicates transcripts that are not properly edited. Red shading highlights dual (nuclear and mt) transcription and proper processing of dual intact cox2 genes in a given plant; tan indicates dual intact genes or dual transcription, but not both. Nuclear cox2 transcripts in Eriosema, Atylosia, Ramirezella, Psoralea, and Otholobium were not assayed and are inferred from the partial to complete absence of mt cox2 in each plant. Green rectangles and names indicate inactivation of mt cox2 whereas blue circles and names indicate inactivation of nuclear cox2. The phylogenetic tree is one of three equally parsimonious trees obtained from parsimony analysis of a data set consisting of 2,154 bp of two chloroplast gene sequences (rbcL and ndhF) and 557 chloroplast restriction sites. See supplemental material at www.pnas.org for details of this and other analyses. Bootstrap values above 40% are shown.

