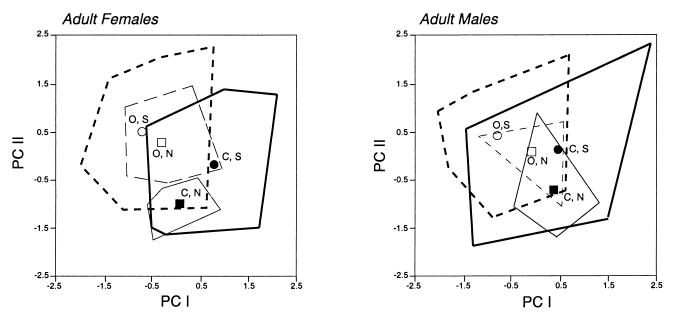
Figure 2.
Plot of the first two PC axes resulting from analysis of log-transformed morphological variables in C. rubrigularis. Sexes are plotted separately. Points from a single region and habitat are enclosed by minimum convex polygons (heavy lines, area south of the BMC; light lines, area north of the BMC; dashed lines, open forest; solid lines, closed forest). Group centroids are shown (C, closed forest; O, open forest; N, north of the Black Mountain Corridor (BMC); S, south of the BMC).

