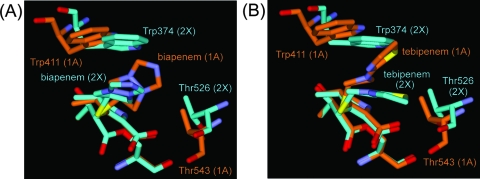
FIG. 4.
Comparison of the PBP 2X and PBP 1A complexes. (A) Superpositioned active-site regions of PBP 2X (light blue)- and PBP 1A (orange)-biapenem complex structures. Biapenem and the side chains of the Trp and Thr residues in the active sites are shown as thick sticks. Atoms are colored as described for Fig. 2A, except that the carbon atoms in PBP 2X- and PBP 1A-carbapenem complex structures are light blue and orange, respectively. (B) Superpositioned active-site regions of PBP 2X (light blue)- and PBP 1A (orange)-tebipenem complex structures. The models are displayed in the same manner as for panel A.

