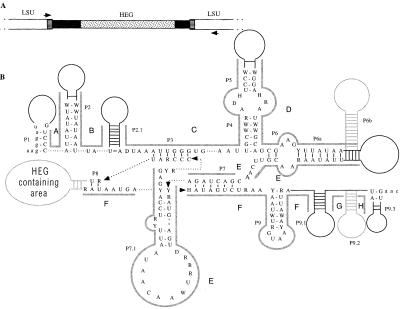
Figure 1.
(A) Structure of ω. White boxes represent the mitochondrial LSU rDNA, black boxes represent the ω group I intron, and the stippled box represents the ω HEG. The two boxes with horizontal lines represent the endonuclease recognition site, which is interrupted by the presence of ω. Also shown are the PCR primer-binding sites (not to scale). (B) Consensus primary and secondary structure of the group I introns, showing base-paired regions P1 to P9.3. If present, HEGs are found in region P8. Solid black lines represent areas of secondary structure that are present in all introns, but are not sequentially conserved. Dashed arrows connect nucleotides that have been separated for ease of display. Stem-loop structures in gray are optional or unalignable (P6b is found only in Kluyveromyces dobzhanskii, K. lactis, Zygosaccharomyces bisporus and Zygosaccharomyces rouxii; P9.2 is found only in Saccharomyces castellii and S. sp-Japan) and were not included in the phylogenetic analysis. Areas A–H, indicated by thick gray lines, are homologous areas that were aligned independently and used in phylogenetic analysis. Exon sequences are in lowercase letters.

