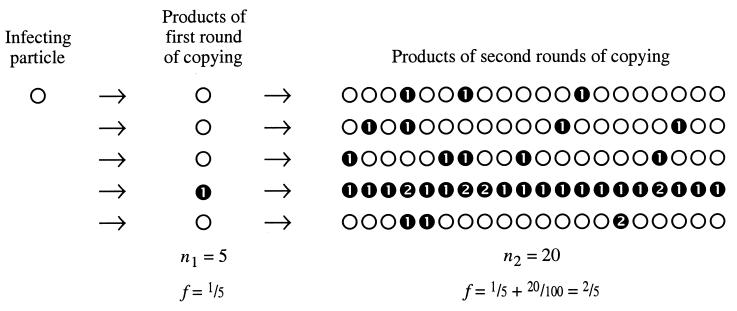
Figure 1.
The accumulation of mutations during a single round of infection. The diagram shows the consequences of an arbitrary μg = 0.2 at both the first and second rounds, and the scheme is simplified by setting n2 = 20 for all second rounds of copying. The burst size is n1n2 = 100. ○, unmutated genomes; ➊, genomes with a single mutation; ➋, genomes with two mutations, which may arise in sequential replications (as in the fourth line) or during a single replication (as in the bottom line).

