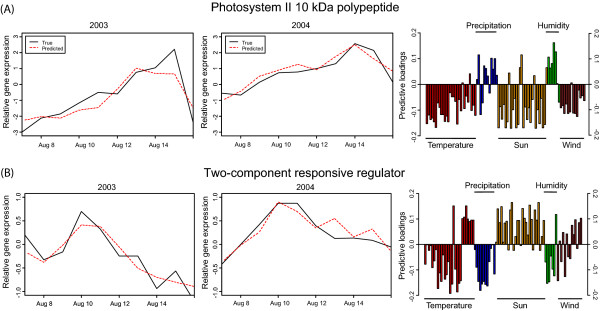
Figure 5.
Characteristic of modelled gene expression. The two first columns show the relative gene expression (black = measured, red = predicted) and the third column correspond to the positive or negative correlation of the weather parameters relative to the gene expression. The third column describes calculated weather parameters and length of bars corresponds to their impact on the gene expression. The weather parameters are further described in additional file 1 and 2. (A) Photosystem II 10 kDa is negatively correlated with temperature, sun and wind but positively correlated with precipitation and humidity (i.e. had a higher expression on rainy days). (B) two-component responsive regulator is positively correlated with temperature variations and sun but negatively correlated with static temperature and sun (i.e. had a higher expression on when the temperature varying).

