Figure 1.
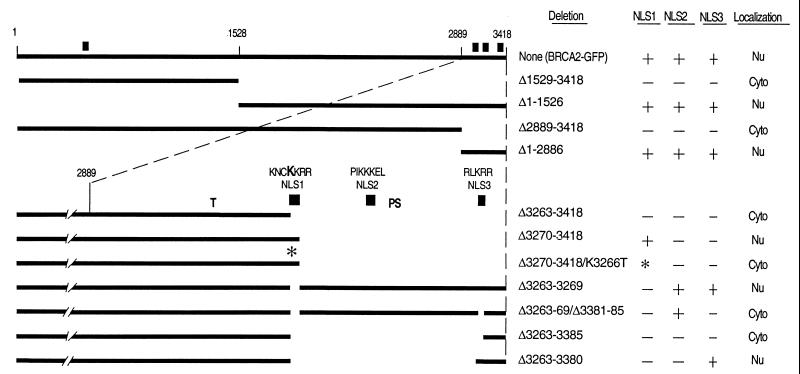
Deletion analysis to identify the functional NLSs of BRCA2. GFP was fused to the C terminus of the depicted BRCA2 regions to facilitate analysis by fluorescence microscopy. Noted at the top are the positions of the first and last BRCA2 residues and the approximate location of the residues corresponding to the NheI (1528) and PmlI (2889) restriction sites used to construct many of these vectors (see Materials and Methods). Thick lines indicate the presence of BRCA2 regions, whereas no line indicates deletions. The composition and relative position of NLS1 (residues 3263–3269), NLS2 (residues 3311–3317), and NLS3 (residues 3381–3385) are given for the constructs depicted in the lower portion of the figure. Note that all C-terminal deletion constructs maintain the entire N-terminal region of BRCA2. ■ marks the approximate positions of the NLS candidates. ∗ indicates the presence of the K3266T mutation introduced into NLS1. The bold K in the NLS1 sequence indicates the residue mutated in this construct. Indicated in the columns to the right are the specific residues deleted, the status of the three C-terminal NLS candidates (+, present; −, absent; and *, mutated) and where the fusion products appear to be localized. “Nu” indicates that the green fluorescence appeared to be predominantly nuclear and “Cyto” indicates predominantly cytoplasmic. “T” marks codon 3195, where the most C-terminal cancer-associated truncation is predicted to terminate (19). “PS” marks the polymorphic stop that has been identified at codon 3326 (25).

