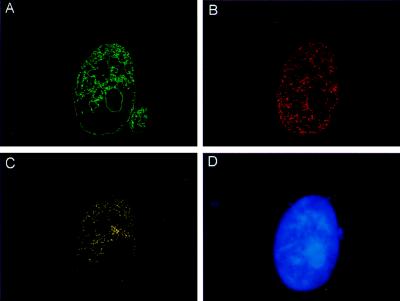
Figure 6.
Colocalization of TdT and Ku after etoposide treatment. Images obtained from the same treated nucleus stained for FITC-αKu (green; A) and rhodamine-αTdT (red; B) were digitized. By using the image processing tool kit (20) in adobe photoshop 4.01, the foci that were not colocalized for both Ku or TdT were subtracted (A and B), and only Ku and TdT foci that were truly colocalized remained (yellow; C). (D) DNA counterstained with 4′,6-diamidino-2-phenylindole (blue).

