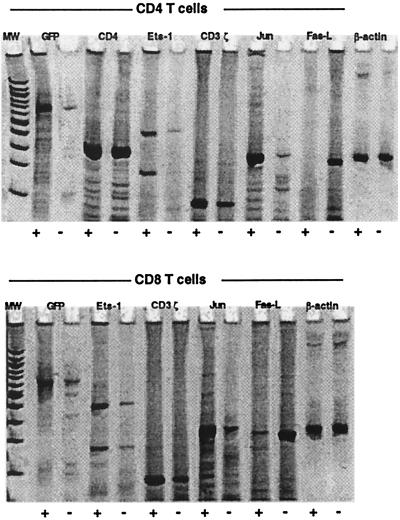
Figure 4.
Differential gene expression in GFP+ and GFP− T cells after immunization. Seven days postvaccinia infection, splenocytes were stained with αCD4 or αCD8 antibodies and sorted based on GFP expression. RT-PCR was performed as detailed in Materials and Methods, and the PCR products were resolved by PAGE. The MW lane shows a 100-bp ladder; the lowermost band represents 200 bp. The larger of the two bands in lanes Ets-1 represents the predicted full-length product.

