FIGURE 3.
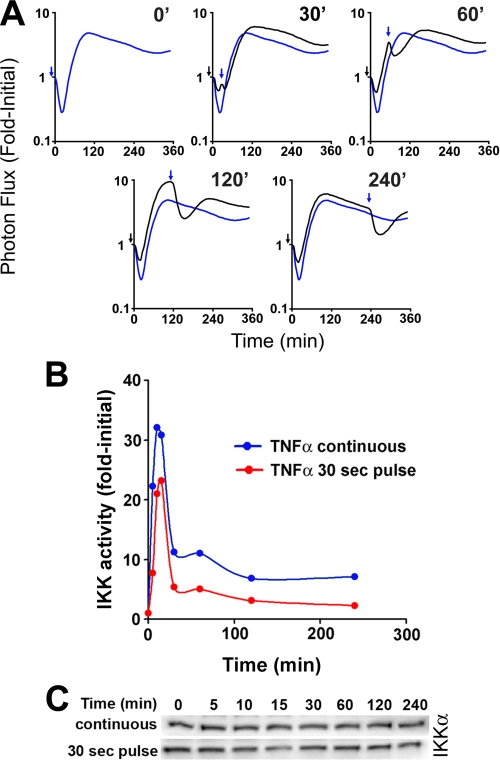
Impact of receptor dynamics and IKK regulation on IκBα responsiveness. A, dynamic live cell bioluminescence imaging profiles of IκBα-FLuc from TNFα preconditioning, IL-1β challenge experiments. The black arrows denote the 30-s preconditioning pulse of TNFα; blue arrows denote the beginning of continuous IL-1β (10 ng/ml) challenge; black profiles represent cells preconditioned and then challenged with IL-1β at the indicated time points; blue profiles represent cells treated at time 0 with continuous IL-1β (denoting the maximal possible degradation response of IκBα upon continuous IL-1β treatment). Data are presented as -fold initial. B, IKK kinase activity was measured at the indicated time points after initiation of a continuous (blue curve) or a 30-s pulse (red curve) of TNFα (20 ng/ml). Results are presented as background-normalized, -fold initial (untreated) controls. C, Western blot analysis of IKKα in cytoplasmic fractions, used as inputs for immunoprecipitation and kinase reactions presented in B.

