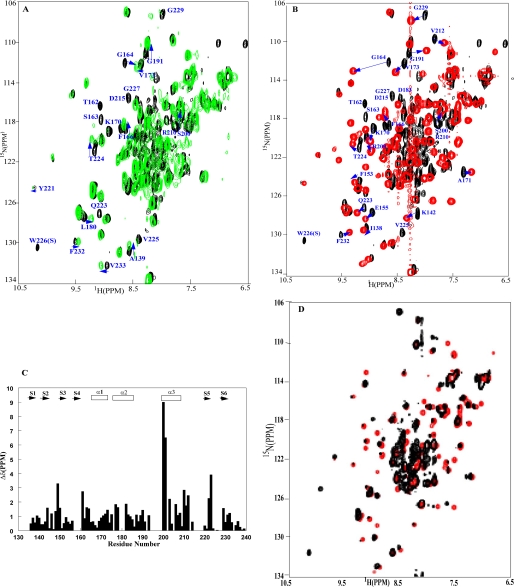
FIGURE 3.
Interactions between the OmpR DNA binding domain and two DNA sites.
A, OmpRC in the presence of an SsrB DNA-binding site
(green, 1:2 ratio of OmpRC to DNA). The label identifying
Gln223 is above the black spectrum; it is
completely shifted in the presence of SsrB DNA. B, OmpRC
in the presence of the OmpR DNA half-site C1b (red, 1:2 ratio of
OmpRC to DNA). The HSQC spectrum in black is the spectrum
of the DNA-free OmpRC. The spectra were acquired at 35 °C, and
in 25 mm phosphate buffer, pH 6.5. The data indicate that the
chemical shift perturbation is greater when the C1 site is used, and that the
monomeric OmpR DNA binding domain can form a stable complex with a strong OmpR
half-site. The perturbed residues that are well resolved in each spectrum are
labeled, and the arrows trace the positions of the perturbed
residues. C, summary of the chemical shift changes observed with
OmpRC in the presence of a C1b site. The vertical axis
corresponds to average chemical variations
 measured on the spectra of the DNA-free OmpRC and the
OmpRC-C1b DNA complex. The amino acid residue number is listed on
the x axis and the secondary structure element is at the top
of the graph, where S signifies a β-strand and α is
α-helix. D, OmpRC in the presence of the DNA
half-site C1a overlaid with the spectrum of OmpRC in the presence
of the DNA half-site C1b at a 1:2 ratio of OmpRC to DNA
(red, C1b site; black, C1a site).

