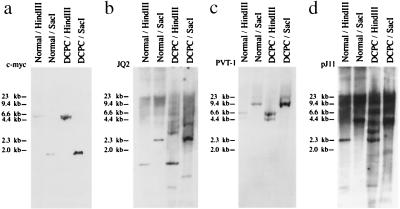
Figure 2.
Southern analysis of 10 μg of genomic DNA of DCPC21 PCT cells (“DCPC”) and normal spleen cells (“normal”). The same blot was hybridized with c-myc (a), the 5′ flanking region of c-myc (JQ2) (b), pvt-1 (c), and IgH (pJ11) (d). Note that c-myc and pvt-1 show germ-line hybridization signals (lanes 1–4, respectively), whereas JQ2 and pJ11 (lanes 3 and 4, respectively) indicate rearrangements (for details, see text). The stronger hybridization intensity of the c-myc and pvt-1 signals (lanes 3 and 4, a and c, respectively) is consistent with the duplicated D2 band in chromosome 15 and the additional c-myc copies of the other 15 chromosomes (Fig. 1a).

