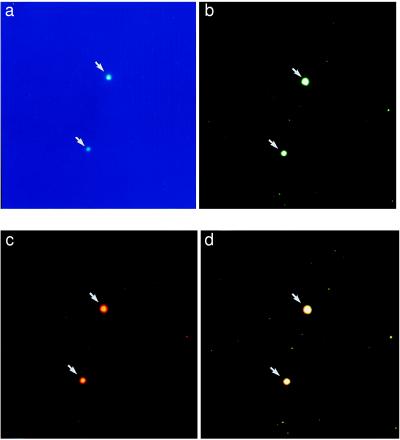
Figure 3.
FISH-EEs. Purified EEs were hybridized with c-myc (green) and IgH (pJ11, red). (a) DAPI counterstain of EEs. Only the large EEs are clearly visible (see arrows). (b and c) The same large EEs shown in a hybridized with c-myc (green) and IgH (red). (d) Overlay of images b and c shows the large EEs in orange (see arrows). This indicates the colocalization of the c-myc and IgH signals on the large EEs. Small EEs carry one or the other hybridization signal and, only occasionally, both. Preliminary analysis of these EEs by electron microscopy indicates that the large EEs are 0.1–0.2 μm in diameter, whereas the little ones are 0.01 μm in diameter (data not shown).

