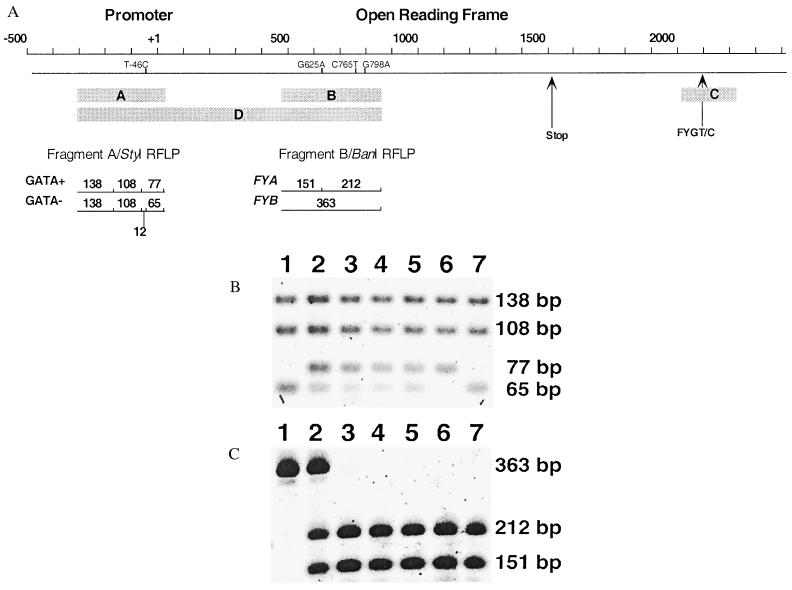
Figure 1.
(A) FY gene locus (human chromosome 1q22-23) and PCR-RFLP genotyping strategies for FY promoter and ORF (6–8). The scale at the top of the figure provides orientation to the FY gene sequence (−/+ coordinates relative to the transcription start site). Positions of previously characterized single nucleotide polymorphisms identified along the linear representation of the FY gene [by using nucleotide (amino acid) nomenclature consistent with erythroid gene product (8)] include T-46C, G625A (G44D), C765T (R91C), G798A (A102T). Promoter-specific (−304 to +25, 328 bp; fragment A) and ORF-specific (+474 to +851, 387 bp; fragment B) amplicons were subject to StyI and BanI restriction endonuclease digestion, respectively. StyI RFLP analysis reveals polymorphism where the 77-bp fragment corresponds with −46T (active GATA-1 site) and the 65-bp fragment corresponds with −46C (inactive GATA-1 site). BanI RFLP analysis reveals polymorphism where the 151- and 212-bp fragments correspond to the Fya-specific sequence 625G (encoding G) and the 363-bp fragment corresponds with the Fyb-specific sequence 625A (encoding D). Additional polymorphisms include C765T (R91C), eliminating an AciI restriction endonuclease cleavage specific for the FY*Bweak allele (14), and G798A (A102T) eliminating an MwoI restriction endonuclease cleavage site in the wild-type FY allele. PCR-based cloning and DNA sequence analysis were applied to the 3′ untranslated region microsatellite (fragment C, arrow) and contiguous promoter-ORF (fragment D) sequences. Allele-specific analysis of fragments C and D enabled precise determination of the linear order of DNA sequence polymorphism potentially obscured by heterozygosity in direct DNA sequencing approaches. (B and C) PCR-RFLP analysis of individual study subjects, lane 1; West African, lane 2; African-American, lanes 3–5; Papua New Guineans, lanes 6 and 7; cloned amplicons (fragment D) derived from the individual in lane 5. (B) Results from StyI digestion of the promoter-specific amplicon-producing restriction fragments of 138, 108, 77, and/or 65 bp. The 12-bp product was not visualized after staining of agarose gels. (C) Results from BanI digestion of the ORF-specific amplicon-producing restriction fragments of 363 and/or 212 and 151 bp. The figure shows the reverse SYBR Gold-stained image scanned with the Storm 860.

