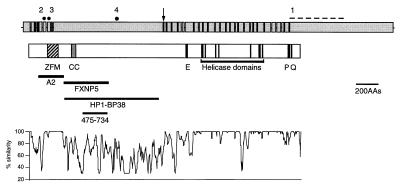
Figure 1.
Structure of the human ATRX gene and protein. The top of the figure shows exons 1–36 (excluding exon 7, which is alternatively spliced) of the human ATRX gene with the introns (not to scale). The position of mutations discussed in the text are marked by solid circles or a dashed line: 1, ped. 26; 2, ped. N29; 3, ped. 12; 4, ped.10. [The mutations are referred to by the pedigree (ped.) in which they were found. Affected members of the same family are distinguished by pedigree order.] The position at which insertion of the trap assay cassette occurred is indicated by an arrow. Below this, the main features of the ATRX protein structure are shown. ZFM, C2—C2 and PHD finger domains; CC, coiled coil; E, stretch of 21 glutamic acid residues; P, a region conserved in other SNF2 proteins; and Q, glutamine-rich region. The positions of the helicase domains are indicated. The locations of recombinant proteins (A2 and FXNP5) used to generate antibodies are shown. HP1-BP38 is the polypeptide that interacts with mHP1α in a two-hybrid screen (10). 475–734, Region that interacts with EZH2. At the bottom of the figure is a plot of percentage similarity between the predicted human and mouse ATRX proteins.

