Figure 2.
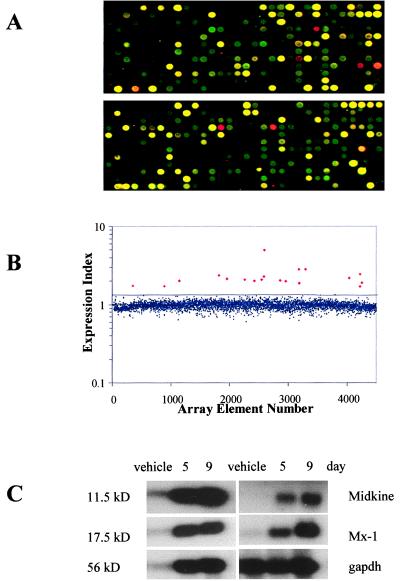
Microarray analysis of gene expression changes in HT29 cells after 5-Aza-CdR treatment. (A) A cDNA microarray containing 4,608 target genes was constructed from a set of minimally redundant expressed sequence tags (ESTs). The microarray was hybridized with cDNAs prepared from vehicle-treated [Cy3-dCTP-labeled (green)] and 500 nM 5-Aza-CdR-treated HT29 cells [Cy5-dCTP (red)] 9 days after treatment. Two representative 12 × 32 gene grids (of 12) are displayed. (B) The fluorescent signal from the hybridized microarray slide was detected, quantified, and plotted as a ratio (Cy-5 signal/Cy-3 signal) for each array element. The average expression ratio for all genes on the array was normalized to 1.0 and had a SD of 0.177. The black line indicates a trend line 2 SD above the mean expression ratio for all genes on the microarray. The small, blue diamonds are genes below this cutoff; the large, red diamonds are genes above the cutoff. (C) Microarray expression data were confirmed by Northern blot analysis. Induction of five representative transcripts (see Table 1) 5 and 9 days after 5-Aza-CdR treatment is shown, along with glyceraldehyde-3-phosphate dehydrogenase (gapdh), an RNA-loading control. 11.5 kD, IFN-inducible protein 27; 17.5 kD, IFN-induced 17-kDa protein; 56 kD, IFN-induced protein 56.

