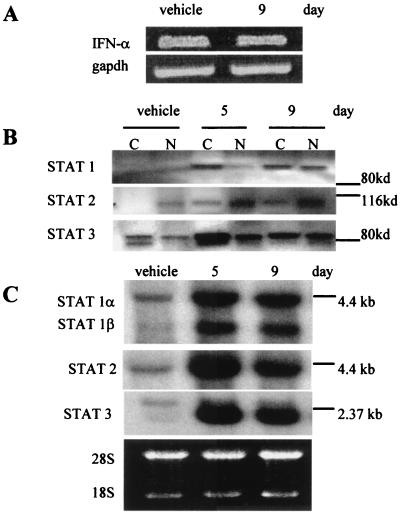
Figure 4.
5-Aza-CdR treatment activates STATs 1, 2, and 3 in HT29 cells. (A) The expression level of IFN-α in HT29 cells before and after 500 nM 5-Aza-CdR treatment was measured by reverse transcription–PCR along with gapdh to confirm equivalent cDNA input. (B) STAT transcription factor levels were measured by Western blotting. Cytoplasmic (C) and nuclear (N) cell extracts were prepared from HT29 cells after treatment with vehicle or 500 nM 5-Aza-CdR. A poly(vinylidene difluoride) membrane harboring the protein extracts was probed sequentially with mAbs specific to STATs 1, 2, and 3. In each case, the antibodies recognized proteins of the appropriate molecular weight for each STAT. Molecular mass markers are indicated. (C) The expression of STAT 1, 2, and 3 genes was measured by Northern blotting. RNA was isolated from HT29 cells after treatment with vehicle or 500 nM 5-Aza-CdR. The locations of molecular mass markers are indicated. Ethidium bromide staining confirmed equal RNA loading (28S, 18S rRNAs).

