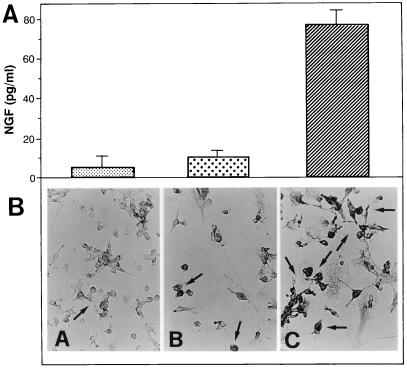
Figure 1.
NGF production by macrophages infected with HIV. NGF production was assessed in the supernatants of M/M immediately before virus challenge (A, small dots) and 5 days after mock infection (big dots) or HIV infection (hatched bar). Immunocytochemical analysis was performed on M/M (B) at the same time points, that is, immediately before virus challenge (A) and 5 days after mock infection (B) or HIV infection (C). NGF production in the supernatants of HIV-infected M/M is statistically greater than that found in the supernatants of mock-infected M/M (either before or after mock infection) [ANOVA: F(2, 6) = 96.448; P = 0.001]. Values represent mean ± SE of an experiment representative of three.

