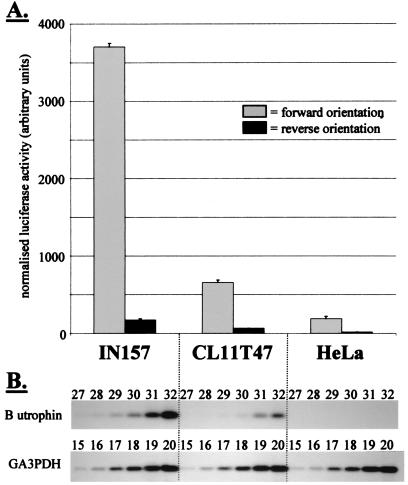
Figure 5.
In vitro activity of utrophin promoter B. (A) Normalized luciferase activity after transfection of three different human cell types with either pGL3/utroB/F (forward orientation) or pGL3/utroB/R (reverse orientation). (B) Semiquantitative RT-PCR to estimate the relative abundance of B-utrophin in the three cell lines. Successive PCR cycles are shown; the numbers above each band correspond to the cycle number at which PCR was stopped. The GA3PDH control shows identical amplification in all cDNA samples, indicating that the differences seen in B-utrophin amplification have arisen from differences in the level of expression of the endogenous B-utrophin transcript in these cell lines. The levels are commensurate with the level of reporter gene activity seen in A.

