Figure 5.
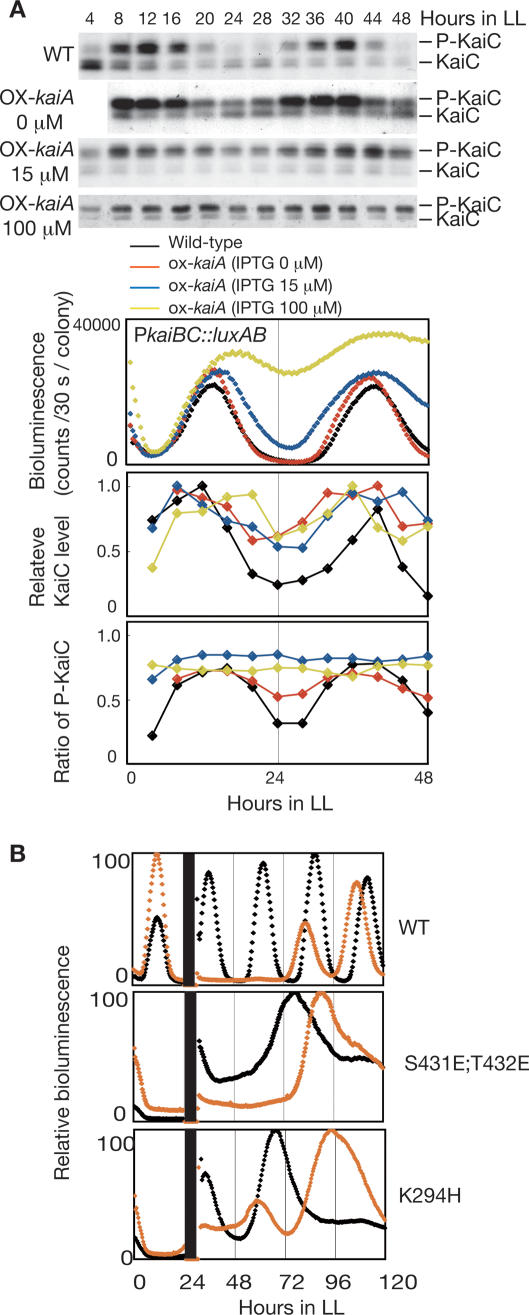
KaiC accumulation and phase resetting of gene expression rhythms. (A) Comparison of the changes in promoter activity, protein accumulation, and phosphorylation. Temporal profiles of bioluminescence, KaiC accumulation, and phosphorylation were examined in kaiA-overexpressing cells induced with 0, 15, or 100 μM IPTG, and wild-type cells. Whole-cell extracts (1.5 μg) were subjected to SDS-PAGE and Western blotting. The top band corresponds to phosphorylated KaiC (P-KaiC) and the bottom band corresponds to unphosphorylated KaiC (KaiC). Bioluminescence was measured under LL conditions. KaiC accumulation (middle) and KaiC phosphorylation (bottom) profiles were analyzed as in Figure 1A. Values at peak times were normalized to 1.0. The average accumulation of KaiC cannot be compared with each IPTG concentration because assays were performed by independent experiments with different exposure times. (B) Phase shifting after kaiC overexpression by IPTG induction. Bioluminescence rhythms of wild-type cells carrying a wild-type kaiC overexpression construct (top panel), KaiC [S431E;T432E] mutant cells carrying a kaiC [S431E;T432E] overexpression construct (middle panel), and KaiC [K294H] mutant cells carrying a kaiC [K294H] overexpression construct (bottom panel) are shown. Cells were treated with water (black line) or 1 mM IPTG (orange line) for 6 h at LL24.

