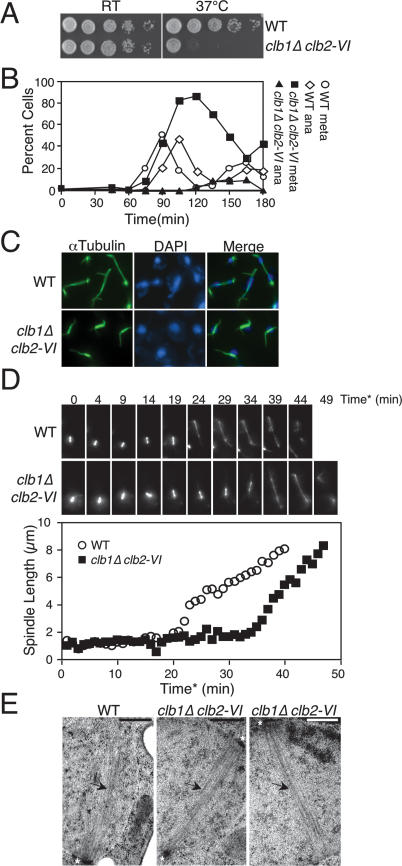
Figure 1.
CLB1 and CLB2 are required for progression through mitosis. (A) Tenfold serial dilution of wild-type (A1411) and clb1Δ clb2-VI cells (A3000), each carrying a Cdc14-3HA fusion on YEPD plates. Plates were incubated at room temperature (RT) or 37°C for 3 d. (B) Wild-type cells carrying a Cdc14-3HA fusion (A1411) and clb1Δ clb2-VI cells carrying Pds1-13Myc and Cdc14-3HA fusions (A12159) were arrested in G1 in YEPD with α-factor (5 μg/mL) for 2.5 h at room temperature. Cells were washed with 10 vol YEP and released into pheromone-free YEPD media prewarmed to 37°C. The percentage of cells in metaphase and anaphase was determined at the indicated time points. At least 100 cells were counted at each time point. (C) Spindle morphology of wild-type (A1411) and clb1Δ clb2-VI (A3000) cells, each carrying a Cdc14-3HA fusion 120 min after release from a pheromone-induced G1 arrest. Microtubules are shown in green, and DNA is shown in blue. (D) Time-lapse series of wild-type (A16772) and clb1Δ clb2-VI (A17122) cells carrying a Tub1-GFP fusion. Cells were prepared as described in the Materials and Methods. For time-lapse series, eight 0.5-μm Z-stacks were collected every minute and the Z-stacks were then projected in the XY plane for spindle length measurements. Spindle length measurements were performed using softWoRx software. Time* corresponds to time after SPB separation, with the 0 time point defined as the first time point at which two separated SPBs are clearly resolved. (Top panel) A time-lapse series of a wild-type cell undergoing anaphase (shown in Supplemental Movie 1). This cell was chosen because it initiated anaphase at a time similar to the wild-type population’s mean anaphase onset time. (Bottom panel) A time-lapse series of a clb1Δ clb2-VI cell undergoing anaphase (shown in Supplemental Movie 2). This cell was chosen because it initiated anaphase at a time similar to the clb1Δ clb2-VI population’s mean anaphase onset time. (Graph) The distance between the two separated SPBs in each cell was measured at every time point in which the spindle was in focus. (E) Electron micrographs of a section of yeast cells prepared by high-pressure freezing and freeze substitution (see Material and Methods). The SPBs are marked by asterisks and microtubules are indicated by arrows. The bar in each image represents 500 nm. (Left panel) Section from a wild-type cell undergoing nuclear division at 37°C. Only one SPB was visible in this section and one-half spindle was clearly resolved. (Middle panel) Spindle from a clb1Δ clb2-VI cell at 37°C. The top SPB was clearly captured in this section whereas segments of the bottom SPB are just visible. The microtubules nucleated by both SPBs are clearly visible and a bipolar spindle is evident. (Right panel) A second representative spindle from a clb1Δ clb2-VI cell at 37°C. The bipolar spindle emanating from two separated SPBs is clearly visible (although only one SPB was contained in this section).

