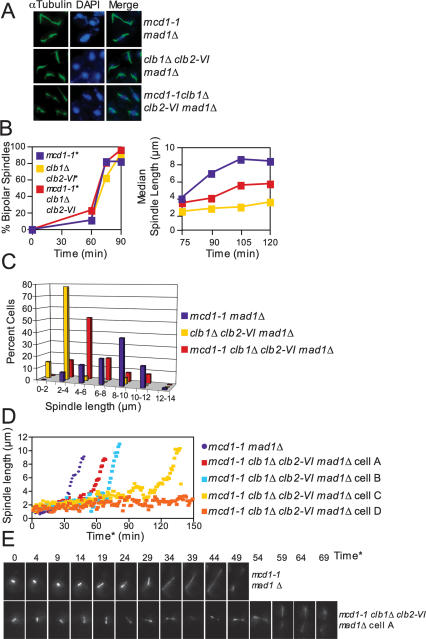
Figure 5.
Clb1/2–CDK activity is required after cohesin cleavage to bring about anaphase spindle elongation. (A–C) mcd1-1 mad1Δ (A2784), clb1Δ clb2-VI mad1Δ Pds1-13Myc (A14770), and mcd1-1 mad1Δ clb1Δ clb2-VI Pds1-13Myc (A14771) cells, each carrying a Cdc14-3HA fusion, were arrested in G1 at room temperature and released into 37°C YEPD as described in Figure 1B. MAD1 was deleted in each strain because cohesin mutants trigger the spindle assembly checkpoint (Severin et al. 2001b). (A) Microtubule and DNA morphologies are shown 105 min after release from G1. Microtubules are shown in green, and DNA is shown in blue. Spindles appeared fragile in mcd1-1 mad1Δ and mcd1-1 mad1Δ clb1Δ clb2-VI cells. This is due to premature separation of sister chromatids, which results in extremely short kinetochore microtubules. (B) The percentage of cells with bipolar spindles (left graph) and the median spindle length of each strain (right graph) were determined at the indicated times (n = 100 spindles at 75 min and 90 min, n = 80 spindles at 105 min, and n = 70 spindles at 120 min). (*) MAD1 was deleted in each strain to prevent activation of the spindle assembly checkpoint. These time points were chosen because they had the highest percentage of cells with bipolar spindles. Box and whisker plots of spindle lengths from this experiment are shown in Supplemental Figure 3A. (C) Spindle length distributions of mcd1-1 mad1Δ, clb1Δ clb2-VI mad1Δ, and mcd1-1 clb1Δ clb2-VI mad1Δ cells 105 min after release from G1 (n = 80 spindles). The 105-min time point was chosen because it had the highest percentage of cells with bipolar spindles. (D,E) Time-lapse series of spindle elongation in mcd1-1 mad1Δ (A17974) and mcd1-1 clb1Δ clb2-VI mad1Δ (A17977) cells, each carrying Tub1-GFP and Cdc14-3HA fusions. Cells were prepared for imaging as described in Figure 1D and in the Materials and Methods. Time* refers to time after SPB separation with 0 defined as the first time point at which SPB separation is visible. (D) The distance between the two separated SPBs in each cell was measured at every time point in which the spindle was in focus. The mcd1-1 clb1Δ clb2-VI madΔ cells A (Supplemental Movie 4) and B, C, and D (Supplemental Movie 5) are shown because they represent the range of spindle elongation phenotypes observed in mcd1-1 clb1Δ clb2-VI mad1Δ cells. (E, top panel) A time-lapse series of a mcd1-1 mad1Δ cell undergoing anaphase (shown in Supplemental Movie 3). This cell was chosen because it initiated anaphase at a time similar to the mcd1-1 mad1Δ population’s mean anaphase onset time. (Bottom panel) A time-lapse series of a mcd1-1 clb1Δ clb2-VI mad1Δ cell undergoing anaphase (shown in Supplemental Movie 4). This cell was chosen because it initiated anaphase at a time similar to the mcd1-1 clb1Δ clb2-VI mad1Δ population’s mean anaphase onset time.

