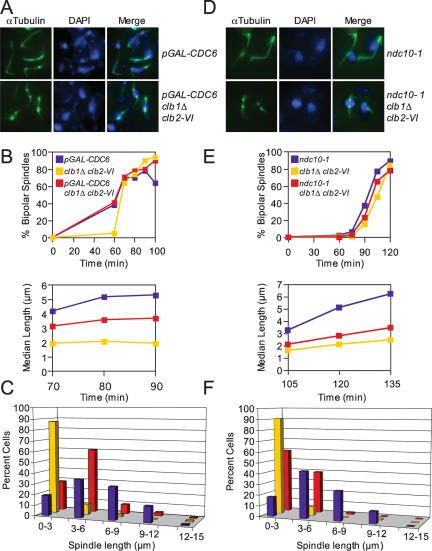
Figure 6.
clb1Δ clb2-VI cells are defective in anaphase spindle elongation. (A–C) mad1Δ cdc6Δ pGAL-Ubi-R-CDC6 Pds1-18Myc (A15078), mad1Δ clb1Δ clb2-VI Pds1-13Myc Cdc14-3HA (A14770), and mad1Δ cdc6Δ pGAL-Ubi-R-CDC6 clb1Δ clb2-VI Pds1-18Myc (A15334) cells were grown in YEP Raffinose + Galactose (YEPRG) at room temperature and arrested in G1 with α-factor (5 μg/mL) for 3 h. Cells were released into α-factor-free YEPRG at room temperature and, after 20 min, glucose was added to repress pGAL-CDC6. Glucose was added after 20 min to allow cells enough time to accumulate sufficient Cdc6 for one cell cycle. α-Factor was added again 75 min after release to arrest cells in G1 of the next cell cycle while pGAL-CDC6 was repressed. Two-hundred-twenty-five minutes after α-factor addition (3 h total), cells were released from their second G1 arrest into YEPD at 37°C. (A) Microtubule and DNA morphologies are shown 90 min after release from G1. Microtubules are shown in green, and DNA is shown in blue. (B) The percentage of cells with bipolar spindles (top graph) and the median spindle length of each strain (bottom graph) were determined at the indicated times (at least 100 cells were examined per time point). These time points were chosen because they had the highest percentage of cells with bipolar spindles. Box and whisker plots of spindle lengths from this experiment are shown in Supplemental Figure 3B. (C) The distribution of spindle lengths 90 min after release from G1 is shown (at least 100 spindles were measured). The 90 min time point was chosen because it had the highest percentage of cells with bipolar spindles. (D–F) ndc10-1 (A2733), clb1Δ clb2-VI (A3000), and ncd10-1 clb1Δ clb2-VI (A15260), each carrying a Cdc14-3HA fusion, were grown in YEPD at room temperature and treated as described in Figure 1B. (D) Microtubule and DNA morphologies are shown 120 min after release from the G1 arrest. Microtubules are shown in green, and DNA is shown in blue. (E) The percentage of cells with bipolar spindles (top graph) and the median spindle length of each strain (bottom graph) were determined at the indicated times (at least 100 cells were examined per time point). These time points were chosen because they had the highest percentage of cells with bipolar spindles. Box and whisker plots of spindle lengths from this experiment are shown in Supplemental Figure 3C. (F) The distribution of spindle lengths 120 min after release from G1 is shown (n = 100 spindles). The 120 min time point was chosen because it had the highest percentage of cells with bipolar spindles.

