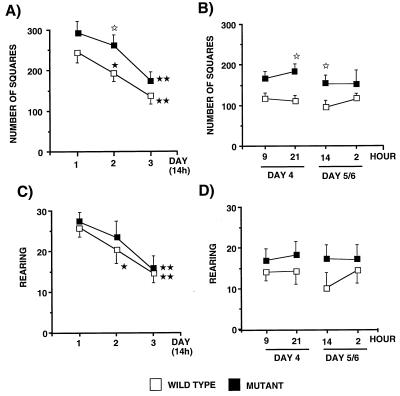
Figure 2.
Number of squares crossed (A and B) and rears (C and D) in the open field by CREM mutants (n = 11) and wild-type littermates (n = 11). The behavioral test was performed at 14:00 on 3 consecutive days. On day 4, animals were exposed to the test at 9:00 and 21:00, and at 14:00 and 2:00 on day 5 and 6, respectively. Values represent mean ± SEM. ★, P < 0.05; ★★, P < 0.01 vs. same group on day 1 (A and C) or day 4 at 9:00 (B and D) (Dunnett’s t test); ⋆, P < 0.05; vs. wild-type group at the same time point (one-way ANOVA).

