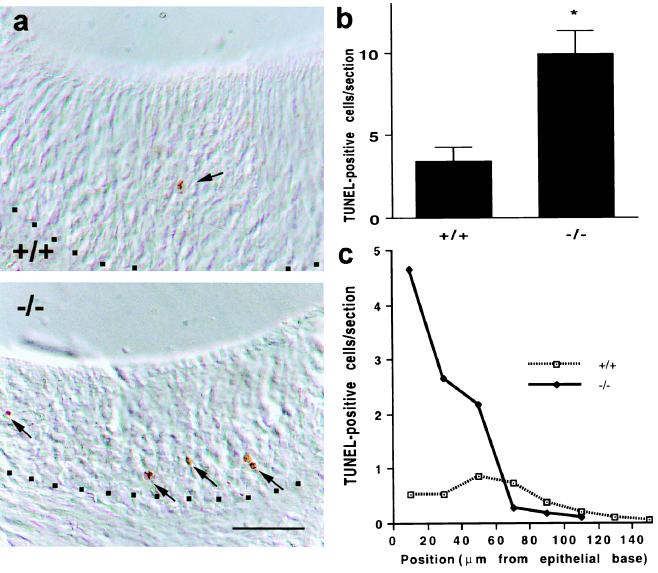
Figure 3.
Apoptosis of basal VNO cells in Go −/− mice. (a) P15 VNO sections from wild-type and Go −/− mice were stained for apoptotic figures by the TUNEL method. Positive staining is visualized as a brown reaction product in differential interference contrast microscopy images (arrows). The base of the epithelium is indicated by dots. (Bar = 50 μm.) (b) The number of TUNEL-positive structures was measured throughout the epithelium of sections through the mid portion of the P15 VNO. The number of TUNEL-positive figures is significantly greater in the Go −/− mice than in controls (*, P ≤ 0.05, Student’s two-tailed t test). The data are means ± SEM from 5–8 animals in each group. (c) The number of TUNEL-positive structures was measured relative to distance from the base of the P15 VNO epithelium as in a and b. The average number of positive cell corpses per section for each 20-μm increment from the base is illustrated. Note that the increased TUNEL staining in the Go-deficient VNO is localized to the basal portion of the epithelium. The data are from 5–8 animals in each group.

