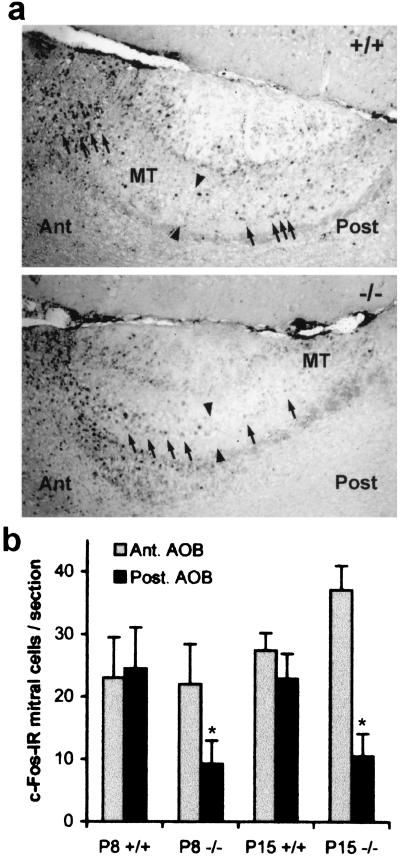
Figure 6.
Reduced c-Fos-IR in the mitral cells of the posterior AOB in Go −/− mice. (a) P15 AOB parasagittal sections were stained with anti-c-Fos. The following features are labeled: mitral and tufted cell layer (MT), anterior (Ant), posterior (Post), and the border of the two AOB lobes (arrowheads). In the Go −/− sections, the posterior MT layer has fewer c-Fos-IR nuclei (arrows) than the +/+ sample. The width of the (Post) label corresponds to 70 μm. (b) The number of c-Fos-IR mitral cell nuclei was quantitated in mid AOB sections from P8 and P15 mice for the anterior and posterior portions. The number of c-Fos-IR cells in the posterior AOB is decreased significantly in the Go −/− mice compared with the number in +/+ control samples (*, P [ltequ} 0.05, Student’s two-tailed t test). The data are means ± SEM from 5–8 animals in each group.

